In embedded systems, GUI redesign is not a creative whim but an economic inevitability: once the interest on design debt in usability inefficiency, support cost, and lost credibility outpaces the cost of renewal, clarity has become more expensive to maintain than to rebuild.
This principle applies across industrial HMIs, medical device interfaces, and automotive displays. Teams that have maintained embedded GUIs through multiple hardware generations recognise a characteristic pattern: incremental usability fixes eventually stop producing proportional returns. What begins as rational maintenance (patching layouts, adjusting navigation, refining error messages) transforms into a burden where each improvement costs more than the last while delivering less benefit. This inflection point represents an economic threshold that can be measured, predicted, and acted upon with the same discipline applied to any capital maintenance decision.

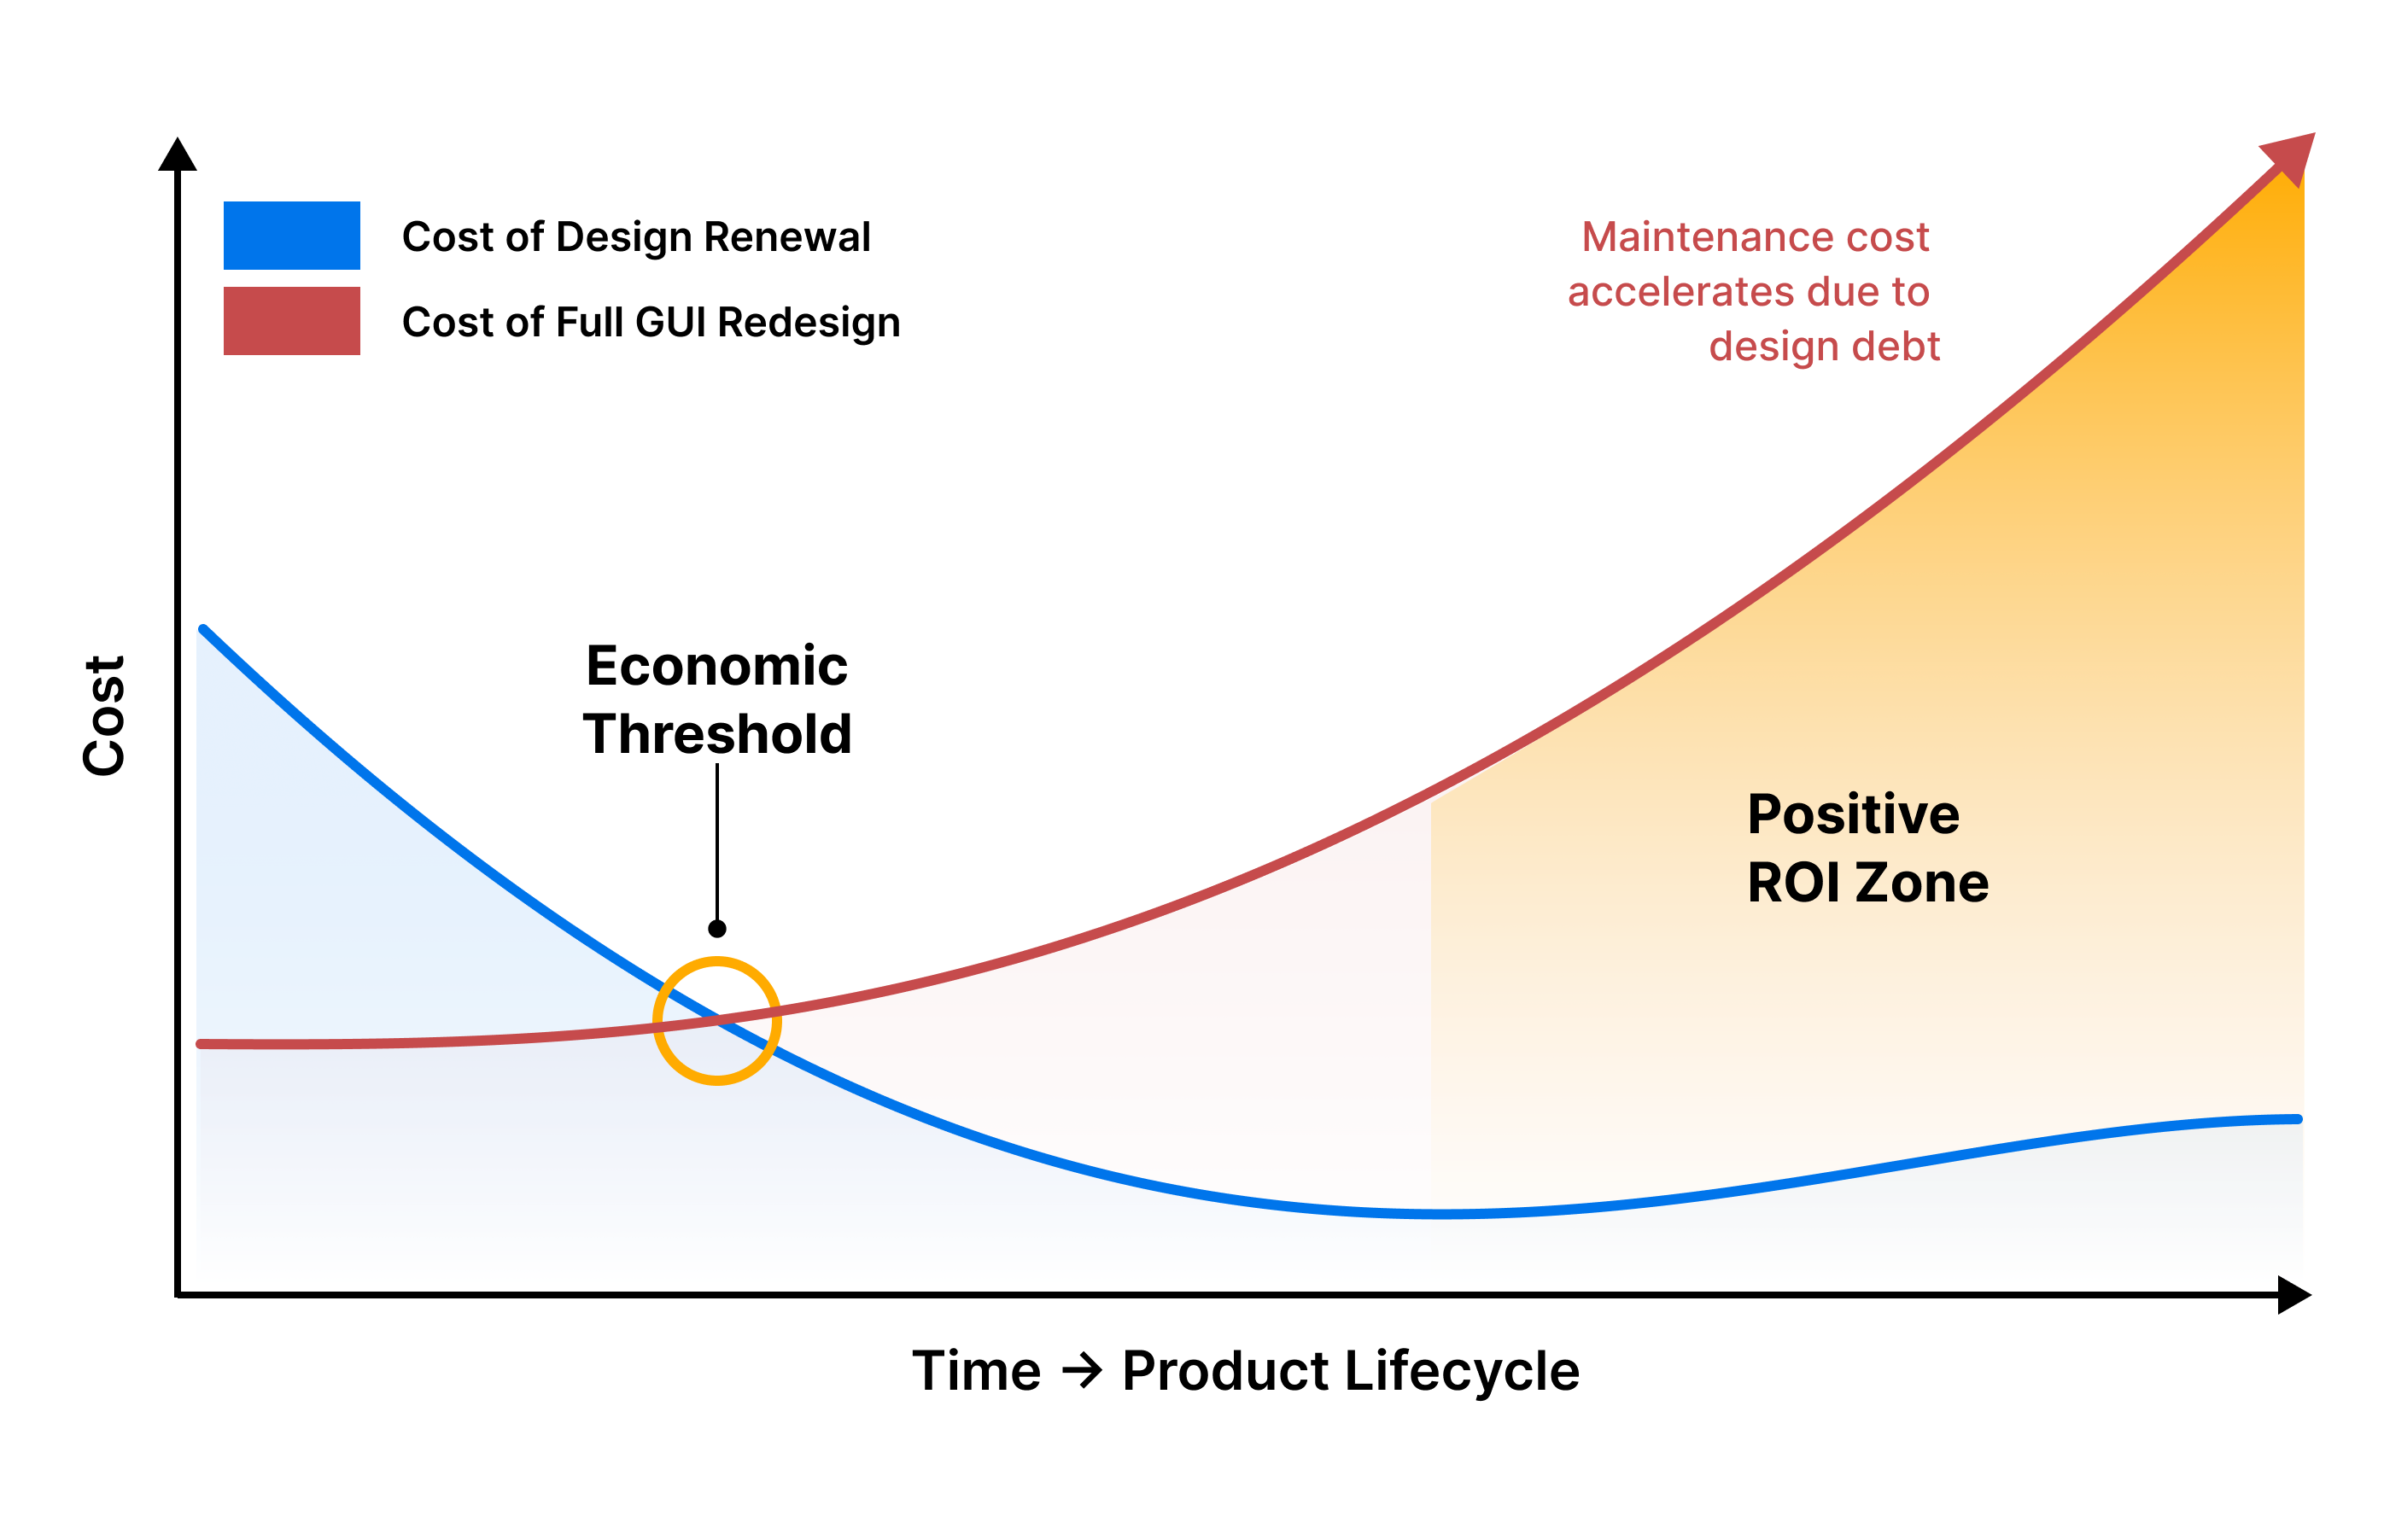
Figure - Economic inflection point showing when redesign becomes more cost-efficient than continued maintenance.
Clarity, in this context, is the felt transparency of workflow (the visible surface of usability). When operators can complete tasks without consulting documentation, when error rates remain low under time pressure, when training transfers efficiently across personnel changes, clarity is present. When these conditions deteriorate despite successive interface refinements, design debt has accumulated to the point where maintaining clarity costs more than rebuilding it.
1. What is design debt in embedded GUIs?
Design debt is the accumulated maintenance cost of interface decisions that optimised for immediate delivery at the expense of long-term clarity.
The concept parallels technical debt, introduced by Ward Cunningham in 1992 to describe code that becomes progressively harder to modify. Where technical debt manifests in brittle architecture and tangled dependencies, design debt appears in interfaces that resist improvement without structural intervention. Both forms of debt share a common characteristic: they compound over time, extracting interest payments through increased maintenance burden.
In embedded GUIs, design debt accrues in several recognisable forms. Navigation hierarchies designed for an initial feature set become labyrinthine as capabilities expand over product generations. Visual patterns established for one display resolution create problems when ported to different screen technologies. Interaction models built around physical buttons prove awkward when adapted to capacitive touch. Information architectures optimised for domain experts become opaque to operators with different mental models or training backgrounds.

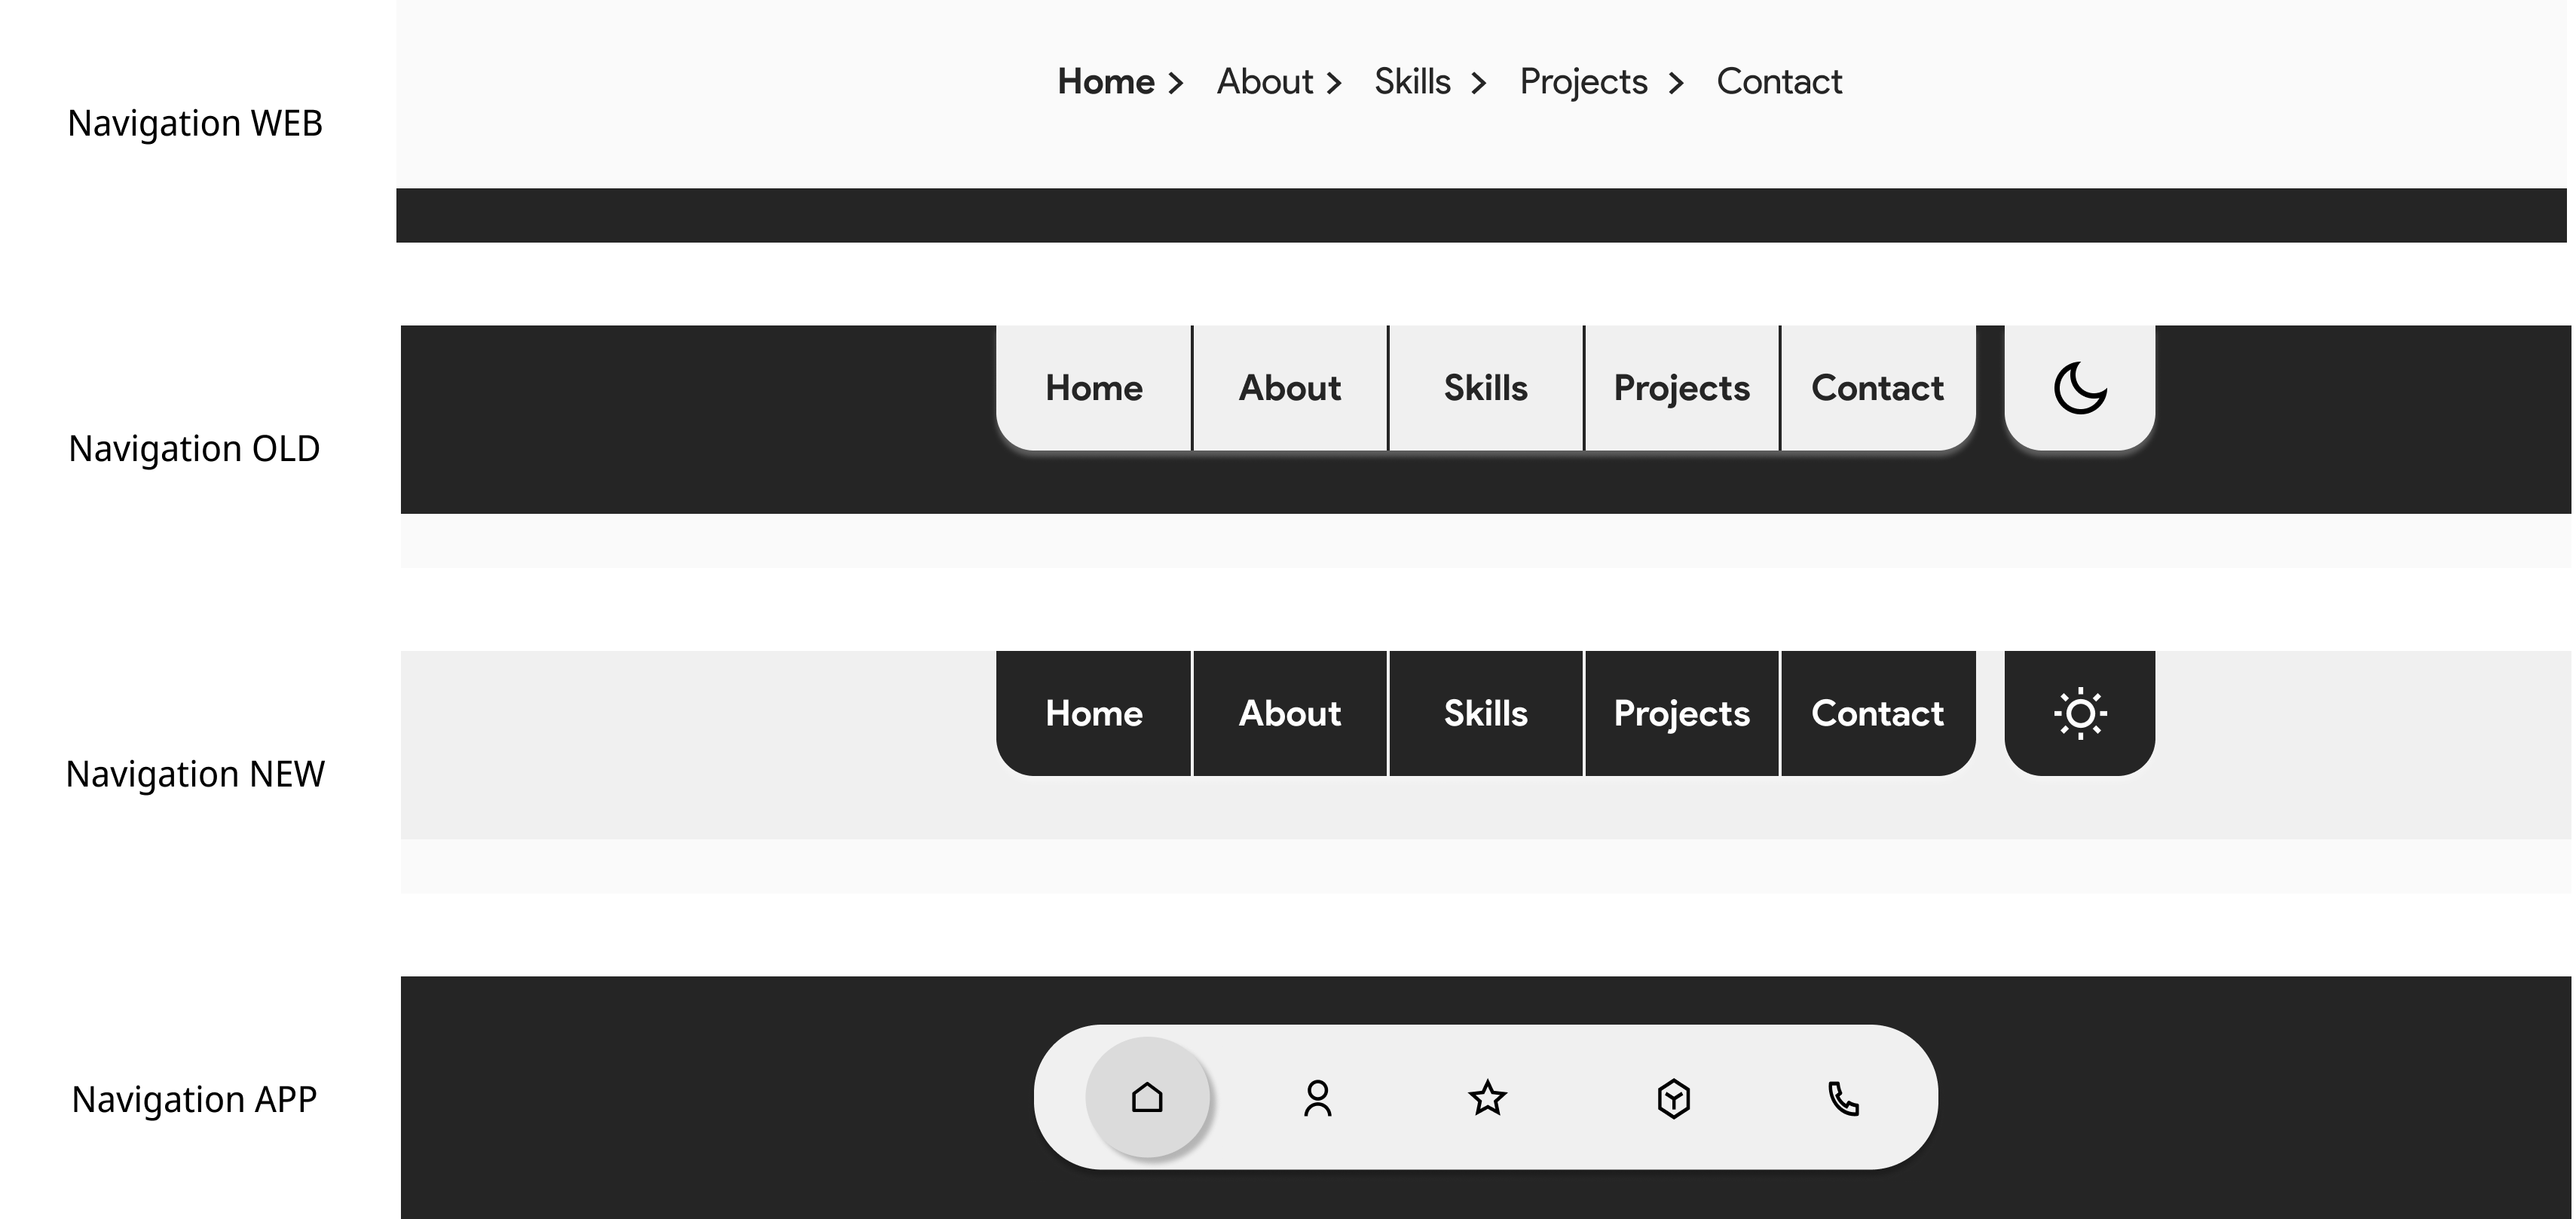
Figure - Fragmented navigation patterns showing how incremental updates erode clarity across GUI generations.
These issues arise because early design assumptions harden into architecture, making later fixes disproportionately expensive. A navigation structure that seemed logical with 12 screens becomes unwieldy with 40. An alarm-priority scheme designed for 20 fault types breaks down with 80. A colour-coding convention that worked on a 7-inch display fails on a 4-inch display under direct sunlight.
The distinguishing characteristic of design debt in embedded systems is its coupling to hardware constraints, regulatory requirements, and operational persistence. Unlike web or mobile interfaces that iterate continuously, embedded GUIs often remain unchanged across 3–7 year product lifecycles. A navigation flow that adds 15 seconds to a critical diagnostic task becomes fixed in place, imposing that time cost on every operator, every shift, every day. Based on field data from industrial installations, a 15-second inefficiency repeated 30 times per shift across 200 deployed units costs 1,500 operator-hours annually, approximately $75,000 at $50/hour fully-loaded labour cost.
Having defined design debt, the next question is how to recognise when incremental fixes stop paying off.
Key takeaway: Teams that document usability issues but find most require changes to foundational information architecture or interaction patterns have crossed into design debt territory.
2. When do incremental fixes no longer pay off?
The usability plateau appears when support costs, training time, and error rates remain elevated despite successive rounds of interface refinement.
Several diagnostic signals indicate this threshold. Support ticket volume related to interface confusion persists above 2 tickets per deployed unit per quarter despite targeted improvements. System Usability Scale (SUS) scores stagnate in the 60–70 range regardless of refinements (below the 68-point threshold generally considered acceptable). Training documentation grows more detailed to compensate for interface ambiguity rather than becoming simpler. Field engineers develop unofficial workarounds that bypass intended workflows, creating shadow procedures that diverge from validated operation.
Architecture strain provides complementary evidence. Feature requests that should be straightforward (adding an alarm category, exposing a parameter, reorganising a settings menu) trigger cascading changes across multiple screens. The GUI framework, whether Qt 5.x, Crank Storyboard, LVGL 8.x, or proprietary code, begins showing its age through performance bottlenecks on newer processors or incompatibility with evolving display technologies like AMOLED or e-paper.
Support escalation patterns reveal the economic friction directly. First-tier support can no longer resolve interface-related issues through standardised guidance, requiring escalation to engineering. These interruptions consume 8–12 engineering hours per escalation when including context switching and documentation updates. Customer training requires 20–30 percent longer to achieve the same competency levels compared to earlier product versions. Field service visits allocate increasing time to interface orientation rather than equipment maintenance.
Boundary conditions: when not to redesign
Not every usability plateau justifies redesign. Interfaces approaching end-of-life within 12–18 months rarely warrant the investment (incremental support cost generally remains below redesign cost over that horizon). Products with small installed bases (fewer than 50 units) face different economics; redesign may not amortise effectively unless aligned with a major version transition. Regulatory environments requiring extensive revalidation, such as FDA Class III medical devices or EN 50128 SIL-4 railway systems, demand that redesign coincide with recertification windows (isolated GUI updates impose prohibitive validation costs).
These signals share a defining characteristic: the marginal cost of addressing usability issues through incremental fixes exceeds the marginal benefit. The interface has reached a state where clarity cannot meaningfully improve without addressing structural decisions made years earlier. Consequently, teams find themselves maintaining an interface that satisfies neither operators nor maintainers, paying ongoing interest on design debt without retiring the principal.
Key takeaway: When support documentation for a GUI grows longer while the feature set remains stable, the cost of maintaining clarity has begun outpacing the cost of achieving it through renewal.
3. What is the inflection point of the Cost-of-Clarity Curve?
The Cost-of-Clarity Curve describes the economic relationship between incremental fixes and redesign, showing the point where cumulative patch costs exceed renewal investment.
The Cost-of-Clarity Curve is our shorthand for the diminishing returns on usability fixes once design debt compounds. In early product life, small improvements yield substantial returns. Adjusting button labels, refining colour coding, or streamlining a frequently-used workflow reduces error rates by 10–20 percent and training time by similar margins. The cost of these changes remains modest (typically 2–8 engineering hours each) relative to their impact.
As the interface matures and architecture debt accumulates, this relationship inverts. Each subsequent improvement requires navigating around prior constraints. A single button label change demands updates to training materials, user documentation, contextual help systems, and support scripts (12–20 hours of effort for what should be a 30-minute task). A workflow refinement conflicts with established muscle memory across the installed base, requiring extensive communication and potentially triggering support escalations. The cost of change increases while the magnitude of improvement diminishes.
The inflection point occurs when the accumulated cost of maintaining acceptable clarity through incremental fixes exceeds the projected cost of achieving superior clarity through renewal. This calculation accounts for several factors: the ongoing support cost differential, the productivity impact on end users, the engineering time absorbed by interface maintenance, and the opportunity cost of features deferred due to architecture constraints.
Organisations that have measured this transition report support ticket reductions of 20–40 percent following well-executed renewals aligned with hardware refresh cycles. Training time for new operators decreases by 25–35 percent. Engineering teams recover 15–25 percent of their capacity previously lost to navigating interface architecture debt. These gains compound over the subsequent product lifecycle, typically offsetting the upfront renewal investment within 12–24 months in industrial contexts with installed bases exceeding 100 units.
The curve's shape varies by framework and domain. Qt applications with well-maintained QML architectures show gentler curves (design debt accumulates more slowly). LVGL implementations on resource-constrained microcontrollers show steeper curves (memory limitations force early architectural decisions that prove difficult to revise). Medical device interfaces under IEC 62366-1:2020 usability engineering requirements show inflection points tightly coupled to validation cycles (partial updates impose nearly the same validation burden as complete renewal).
This economic model clarifies that redesign is not an alternative to maintenance but a form of maintenance (scheduled renewal that prevents interest payments on design debt from exceeding principal retirement costs).
Key takeaway: Quantifying the fully-loaded cost of interface-related support tickets, including engineering interruptions and field service time, often reveals that the economic case for renewal emerged 6–18 months before the decision was considered.
4. How can you measure design debt economically?
Design debt translates into measurable operational costs: support burden, training overhead, productivity loss, and constrained development velocity.
Framing design debt as interest payments makes the cost structure explicit. Each usability inefficiency extracts recurring toll. An extra 30 seconds required to complete a routine task, multiplied by 50 executions per shift, multiplied by 3 shifts per day, multiplied by 250 operating days, multiplied by 200 deployed units, equals 625,000 seconds (approximately 174 hours) of lost productivity annually. At $50/hour fully-loaded operator cost, this single inefficiency costs $8,700 per year.
Cost indicators and measurement approaches
| Cost Indicator | Measurement Approach | Threshold Value | Economic Impact |
|---|---|---|---|
| Support ticket density | Interface-related tickets per unit per quarter | >2.0 tickets/unit/quarter | $500–800 per ticket × frequency |
| Task completion time variance | 90th percentile ÷ median completion time | >2.5× suggests workflow ambiguity | Productivity loss: variance × frequency × labour cost |
| Training time per operator | Hours to reach competency benchmark | Increasing >15% per product version | Training cost + delayed productivity value |
| Documentation-to-feature ratio | Help content pages per GUI function | >0.5 pages/function | Maintenance cost + comprehension barrier |
| Engineering maintenance burden | Developer-hours per quarter on fixes | >15% of GUI team capacity | Engineering cost + opportunity cost |
Table 1 – Design debt cost indicators with measurement thresholds and economic translation
These metrics convert design debt into operational cost. An embedded GUI requiring 40 engineering hours per quarter for usability fixes, at $150/hour fully-loaded cost, imposes $24,000 annually in direct maintenance. If that interface generates support tickets averaging $650 each in resolution cost (including escalation), occurring at 3 tickets per deployed unit per year across 200 units, the support burden adds $390,000 annually. The interest on design debt, in this scenario, reaches $414,000 per year (a figure that makes the business case for renewal straightforward, particularly when redesign costs typically range from $150,000–400,000 for moderately complex industrial HMIs).
Framework influence on debt accumulation
Framework selection influences how design debt accrues. Qt's Model-View architecture and QML declarative syntax support maintainability through separation of concerns, though at the cost of 2–4 MB runtime footprint (prohibitive for some microcontroller targets). Crank Storyboard optimises for deterministic performance on resource-constrained hardware (sub-100 MHz ARM Cortex-M series) but requires deliberate upfront planning of information architecture; retrofitting structural changes demands more effort than in more flexible frameworks. LVGL provides lightweight flexibility suitable for 256–512 KB RAM targets but requires careful management of custom widget maintainability (poorly documented widgets become technical debt that compounds design debt).
Each framework's optimisation—for performance, flexibility, or determinism—determines how design debt accumulates differently. Qt applications with disciplined component libraries can defer renewal longer. LVGL implementations without modular architectures reach the inflection point sooner. As a result, framework selection should account not just for initial development velocity but for expected lifecycle maintenance patterns.
Having quantified design debt economically, the question becomes when renewal makes sense within product lifecycles.


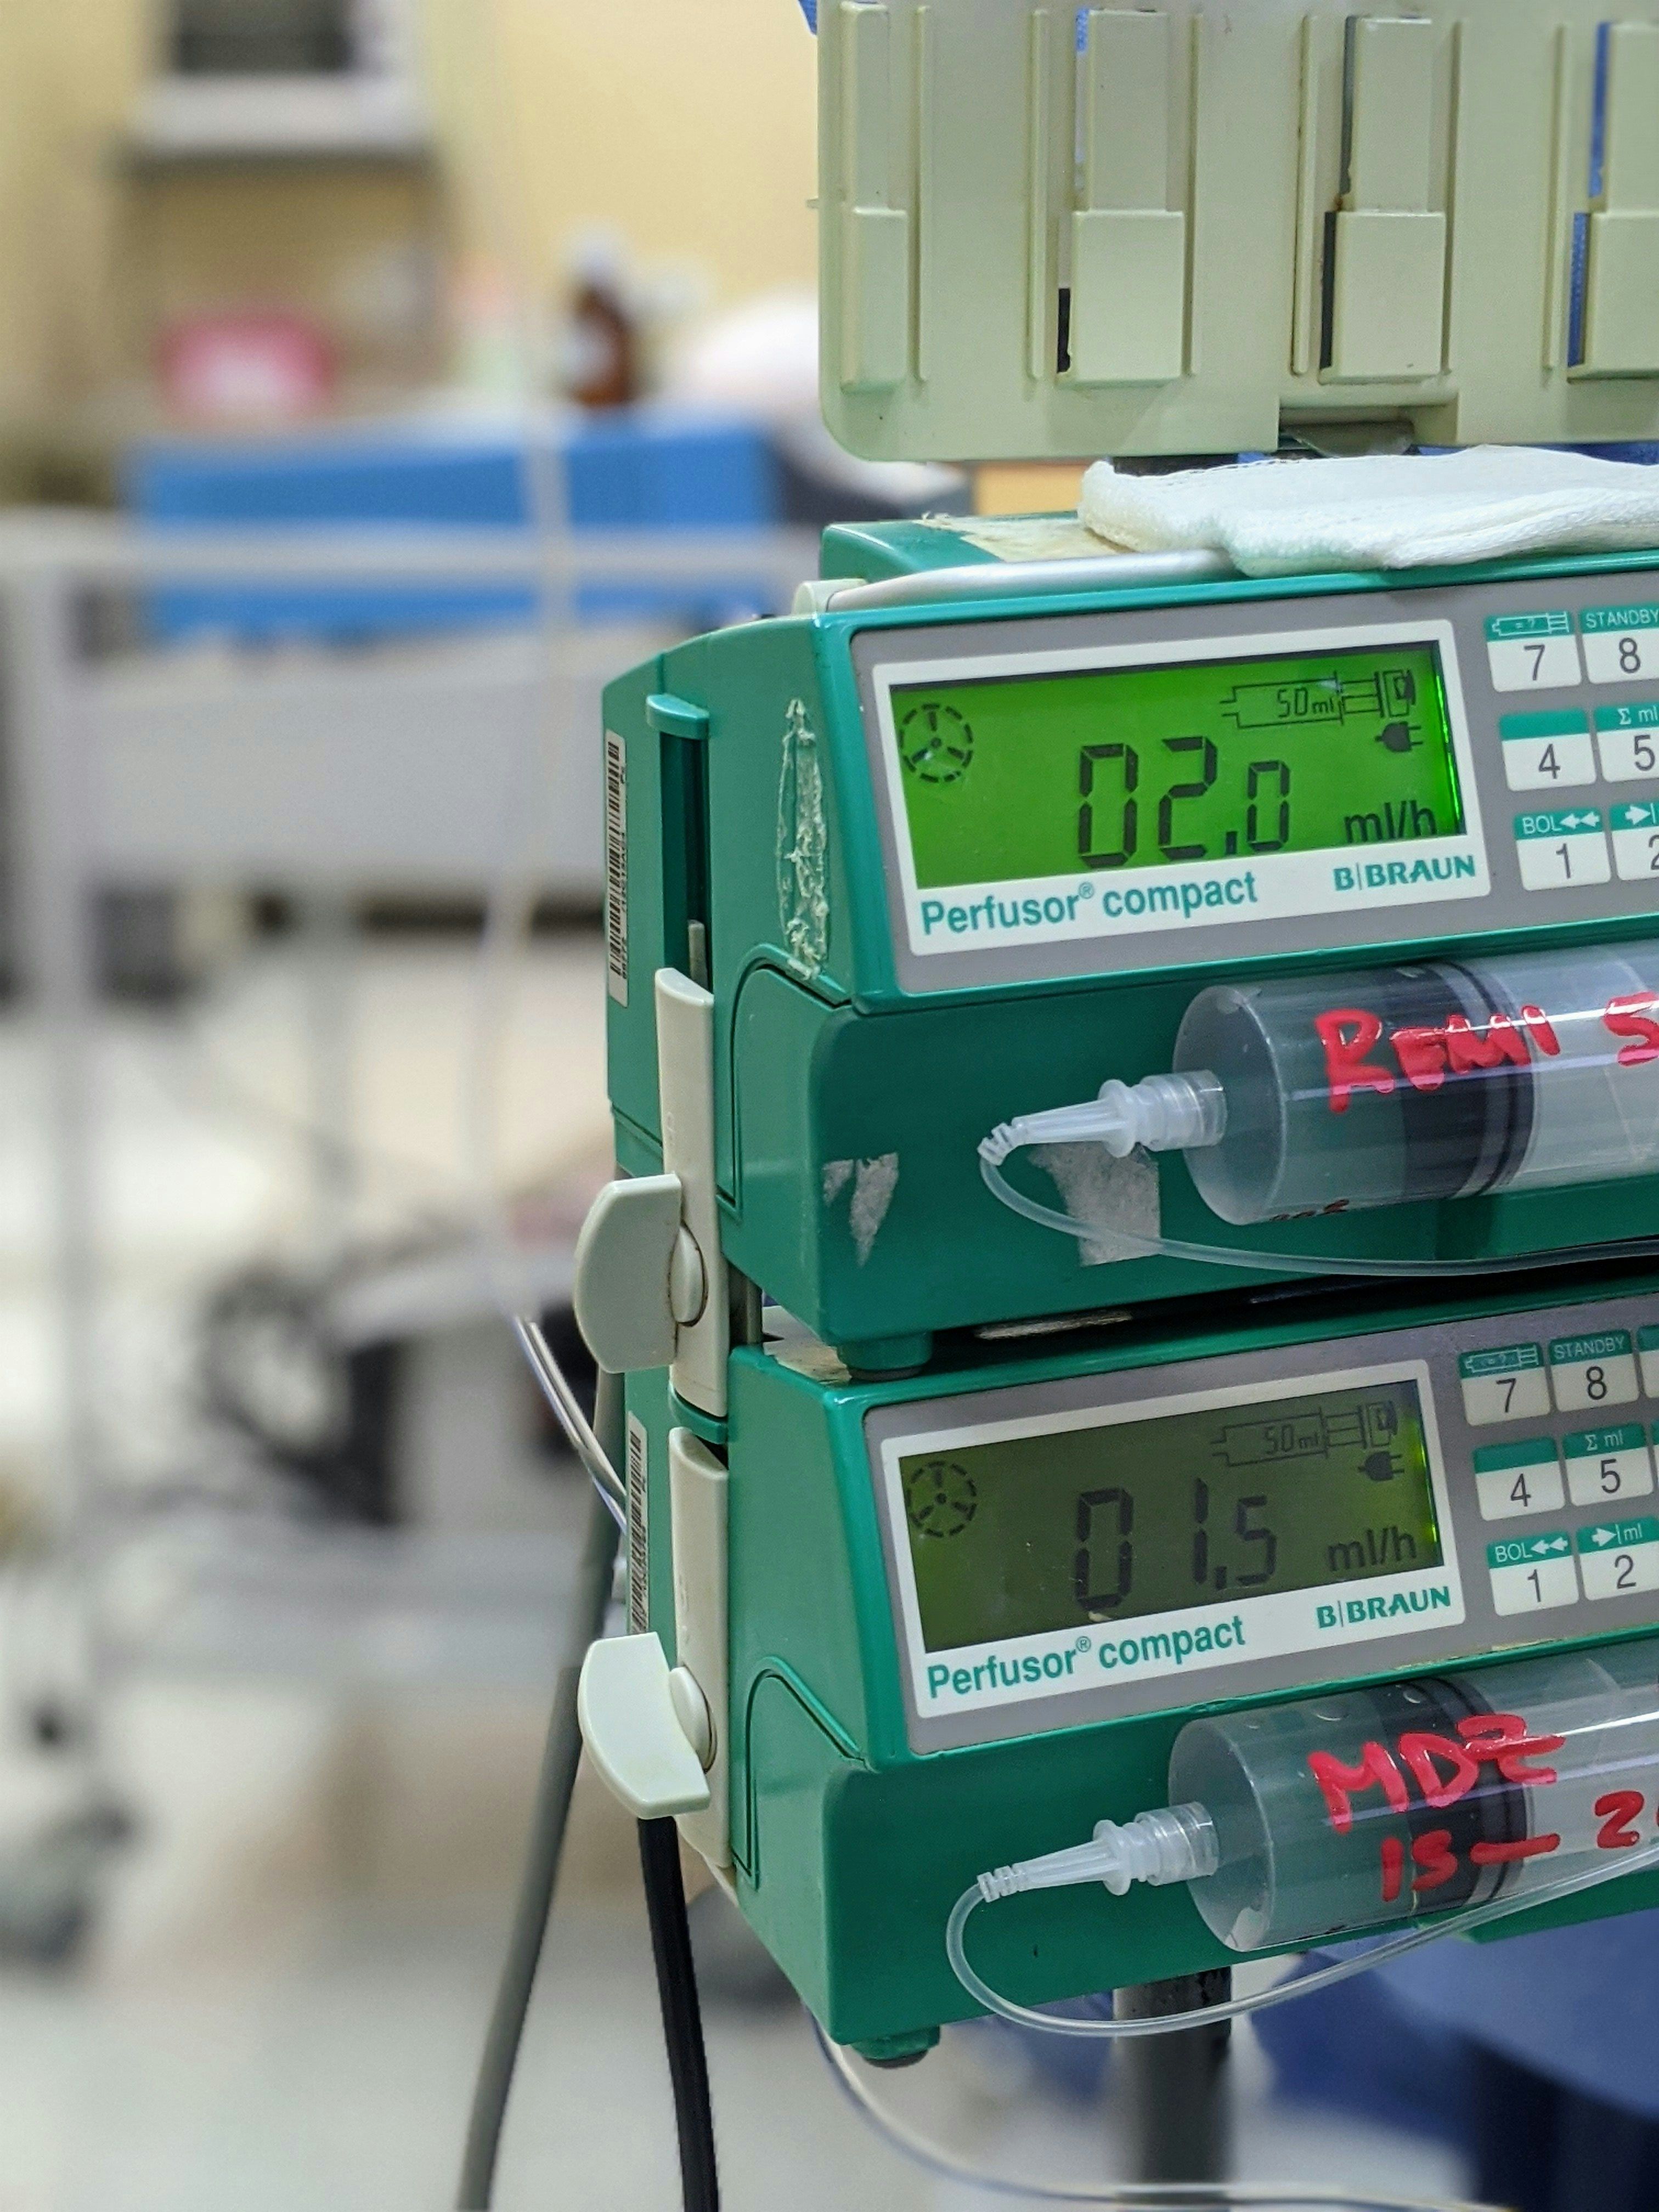
Engineer using large industrial HMI to supervise and control manufacturing processes in a modern factory environment.
Key takeaway: Establishing quarterly measurement of these cost indicators transforms the redesign decision from subjective assessment to portfolio management—the interface becomes a capital asset whose renewal schedule follows depreciation metrics.
5. When to align GUI renewal with other cycles?
GUI renewal achieves optimal economics when synchronised with hardware transitions, regulatory revalidation, or major version releases—moments when change costs are already committed.
In embedded systems, GUI renewal cannot occur independently of hardware evolution and regulatory constraints. ISA-101 (Human Machine Interfaces for Process Automation Systems) emphasises that interface design must reflect operational context and task requirements. IEC 62366-1:2020 (Application of Usability Engineering to Medical Devices) mandates that interface changes undergo risk analysis, formative evaluation, and summative validation. These frameworks create natural synchronisation points for renewal.
Hardware refresh cycles provide the most economically efficient windows. When a product line transitions from one processor architecture to another (for example, from ARM Cortex-A9 to Cortex-A53, or from NXP i.MX 6 to i.MX 8) the engineering effort required to port the existing interface approaches or exceeds the effort required to redesign it on clearer foundations. Display technology transitions show similar economics: porting a resistive-touch interface designed for 800×480 TFT to a 1024×600 capacitive PCAP panel requires substantial rework regardless of whether the information architecture is preserved or improved.
The porting work must happen; the incremental investment to achieve superior clarity rather than functional equivalence often amounts to 15–25 percent additional effort. For a $300,000 porting project, allocating $45,000–75,000 to concurrent redesign captures the momentum of mandatory change. Teams that separate these activities often spend comparable total sums across two distinct projects, neither of which achieves the synergy available through integrated renewal.
Certification and regulatory revalidation cycles impose similar forcing functions. Medical device interfaces undergoing recertification for new indications, geographic markets, or standard revisions require fresh usability validation. Industrial control systems updated to address evolving functional safety standards (IEC 61508, ISO 13849) demand interface review as part of hazard analysis. These mandatory touchpoints eliminate the sunk-cost fallacy that delays renewal (the existing interface will require validation investment regardless, making the marginal cost of renewal rather than replication the relevant comparison).
Counter-intuitively, standalone GUI renewal outside these windows often costs more in fully-loaded terms. Isolated interface updates require dedicated validation cycles, separate documentation updates, and field upgrade logistics. When bundled with hardware refresh, these activities occur anyway, and their cost allocates across the complete system update. Consequently, the economic case for renewal strengthens dramatically when aligned with natural product lifecycle transitions.
Key takeaway: Building a 3–5 year roadmap that maps GUI architecture refresh to hardware generation transitions and certification windows converts renewal from a discretionary project to an integrated lifecycle phase with predictable economics.
6. How can teams manage design debt proactively?
Proactive debt management through design systems, modular architecture, and design rationale documentation slows debt accumulation and reduces eventual renewal scope.
Not all design debt requires full renewal to manage. Teams that establish design systems (reusable component libraries, consistent interaction patterns, documented information architecture principles) create infrastructure that allows incremental improvements to compound rather than conflict. A well-maintained design system functions as preventive maintenance, slowing clarity depreciation.
Modular GUI architecture, separating presentation logic from business logic and data management, preserves flexibility for interface evolution without wholesale replacement. Frameworks that enforce this separation (Qt's Model-View architecture with QML, Crank's Lua scripting layer for application logic, or custom Model-View-ViewModel (MVVM) implementations) enable teams to refresh the presentation layer while preserving validated business logic. The economic benefit appears in the ability to address usability issues without triggering regression risk across unrelated functionality. In practice, well-modularised interfaces allow 40–60 percent of usability improvements to proceed without cross-screen validation, compared to 10–20 percent in monolithic implementations.
Documentation of design rationale provides another debt management tool. When teams record not just what the interface does but why particular structures were chosen (navigation hierarchies, information groupings, interaction patterns) they preserve context that future maintainers need to make coherent improvements. This documentation need not be elaborate. Brief annotations in design tools (Figma, Sketch) or comments in GUI descriptor files (QML, Storyboard .gapp projects, LVGL screen definitions) explaining the reasoning behind critical decisions often suffice.
The contrast between preventive maintenance and reactive rebuild clarifies the value proposition. Preventive maintenance through design systems and modular architecture costs 10–15 percent additional effort during initial development but reduces maintenance burden by 30–50 percent over subsequent years. Reactive rebuilds, triggered only after design debt has reached crisis levels, cost 2–3 times the investment required for planned renewal and occur at inconvenient points in product lifecycles, often forcing rushed work or delayed market introductions.
This principle mirrors the Economics of Clarity more broadly: investing in maintainability early produces compounding returns, while deferring architectural discipline imposes compounding interest payments.
Key takeaway: Teams that allocate 10–15 percent of their GUI development capacity to design system maintenance and architecture documentation find that renewal cycles arrive later, with more manageable scope when they do arrive.
7. How to frame the redesign decision for others?
The business case for renewal must quantify operational efficiency gains and lifecycle economics, not aesthetic preferences. Redesign is capital maintenance, not discretionary enhancement.
Stakeholders with P&L responsibility respond to projections that translate interface improvements into margin impact: support cost reduction, field service efficiency gains, training cost decreases, error rate improvements, and operator productivity increases. The argument succeeds when framed as portfolio management rather than product development.
ROI calculation components
Return on investment for embedded GUI renewal typically includes:
- Support cost differential: Current annual support cost attributable to interface issues ($390,000 in the earlier example) minus projected support cost post-renewal (typically 60–80 percent of current cost, or $234,000–312,000), yielding annual savings of $78,000–156,000. Multiply by remaining product lifecycle (4 years) for total lifecycle benefit of $312,000–624,000.
- Training efficiency gain: Reduced time-to-competency for new operators (25–35 percent decrease) valued at training labour cost plus opportunity cost of delayed productivity. For teams training 20 operators annually at $2,500 per operator including instructor time and lost productivity, a 30 percent reduction yields $15,000 annually.
- Operational efficiency improvement: Time savings on routine tasks valued at operator labour cost and throughput impact across installed base. Eliminating 15 seconds from a 30-times-per-shift task across 200 units yields $8,700 annually per inefficiency addressed; targeting 5 such inefficiencies projects $43,500 annual gain.
- Engineering capacity recovery: Maintenance burden reduction freeing engineering resources for feature development, valued at engineering cost and strategic opportunity value. Reducing maintenance from 40 to 15 hours per quarter recovers 100 hours annually, $15,000 in direct cost plus opportunity value of features that capacity enables.
These components typically project payback periods of 12–36 months for embedded GUI renewals with installed bases exceeding 100 units, depending on interface complexity and degree of architecture debt. When renewal aligns with hardware refresh, the incremental cost of redesign over porting often pays back within 6–12 months.
Framing clarity as operational efficiency positions renewal as a maintenance decision rather than discretionary investment. The interface becomes infrastructure that, like any capital asset (hardware platforms, test equipment, validation tooling) requires periodic renewal to maintain economic productivity. Stakeholders accustomed to approving hardware refresh cycles or software platform updates recognise the same logic applied to the presentation layer.
This reframing addresses the most common objection: that the existing interface "works." Technically functional interfaces that impose excessive support costs, training burdens, or operational inefficiency do not work in economic terms. They function but fail to deliver the clarity necessary for efficient operation. Renewal becomes the rational response to this gap.
Key takeaway: Presenting the redesign decision alongside the cost of not redesigning (projected support costs, lost productivity, and engineering opportunity cost over the next hardware generation) clarifies that the choice is not whether to invest but which investment yields superior returns.
8. When rebuilding is the right choice
GUI redesign in embedded systems represents neither creative indulgence nor avoidable expense. It constitutes a maintenance decision governed by the same lifecycle economics that apply to any capital asset in a product system. Design debt accumulates through the ordinary process of product evolution, extracting interest payments through support costs, training burdens, operational inefficiency, and constrained development velocity.
The discipline required is not in justifying renewal when design debt has reached crisis levels, that case typically makes itself. The discipline lies in recognising the economic inflection point on the Cost-of-Clarity Curve early enough that renewal can be planned rather than reactive, aligned with hardware and regulatory cycles rather than forced by failure, and scoped to address architecture debt rather than merely aesthetic refresh.
Teams that measure the cost of maintaining clarity, who quantify the interest payments on design debt, who synchronise interface renewal with natural product lifecycle transitions, discover that redesign becomes routine maintenance. The interface evolves through planned renewal cycles, each generation learning from accumulated operational data, each iteration reducing debt burden rather than deferring it. This approach embodies the Economics of Clarity: investing strategically in maintainability produces compounding returns, while deferring architectural discipline imposes compounding costs.
When clarity costs more to preserve than to rebuild, renewal is maintenance. The economics of embedded GUI design demand this recognition and reward acting on it with the same rigour applied to any capital maintenance decision.
In embedded systems, redesign is not reinvention, it's the scheduled payment that keeps clarity solvent.
Frequently Asked Questions
Q: How do I know if my embedded GUI has design debt? A: Design debt manifests when usability improvements consistently require changes to foundational architecture rather than isolated adjustments, when support tickets remain elevated despite successive fixes, or when training time increases across product versions despite feature stability.
Q: What is the Cost-of-Clarity Curve? A: The Cost-of-Clarity Curve describes the economic relationship between incremental fixes and redesign, showing the inflection point where cumulative maintenance costs exceed renewal investment. It represents the diminishing returns on usability patches as design debt compounds.
Q: When should I redesign an embedded GUI instead of patching it? A: Redesign becomes economically rational when the Cost-of-Clarity Curve reaches its inflection point, typically when interface-related support costs, training overhead, and engineering maintenance burden collectively exceed the amortised cost of renewal over the remaining product lifecycle, especially when aligned with hardware refresh or certification cycles.
Q: How can I justify GUI redesign to stakeholders? A: Frame renewal as capital maintenance using quantified operational costs: support ticket expenses, training time at labour rates, productivity loss from inefficient workflows, and engineering opportunity cost. Show that these ongoing costs exceed the amortised redesign investment over the product lifecycle.
In this story
In embedded systems, incremental fixes eventually cost more than clarity gained. This article explains how to recognise design debt, read the Cost-of-Clarity Curve, and plan GUI renewal as a strategic maintenance decision.
- 1. What is design debt in embedded GUIs?
- 2. When do incremental fixes no longer pay off?
- 3. What is the inflection point of the Cost-of-Clarity Curve?
- 4. How can you measure design debt economically?
- 5. When to align GUI renewal with other cycles?
- 6. How can teams manage design debt proactively?
- 7. How to frame the redesign decision for others?
- 8. When rebuilding is the right choice
- Frequently Asked Questions